How are percentiles calculated?
Percentiles should be calculated with a sample rate of 0 seconds so the unsampled values are used for an accurate display.
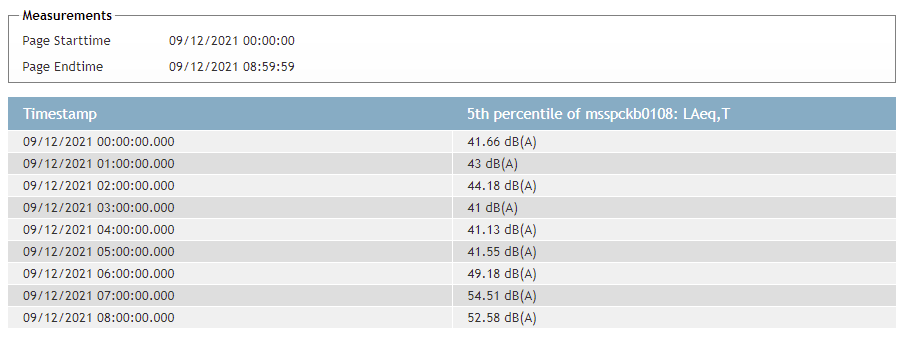
Percentiles are timestamped over the coming hour. The exact times depend on the start time of the query and the window size (or block size). In the example below, the value of 43 dB(A) is calculated over 01:00:00 until 01:59:59 using a window size of 3600 seconds.
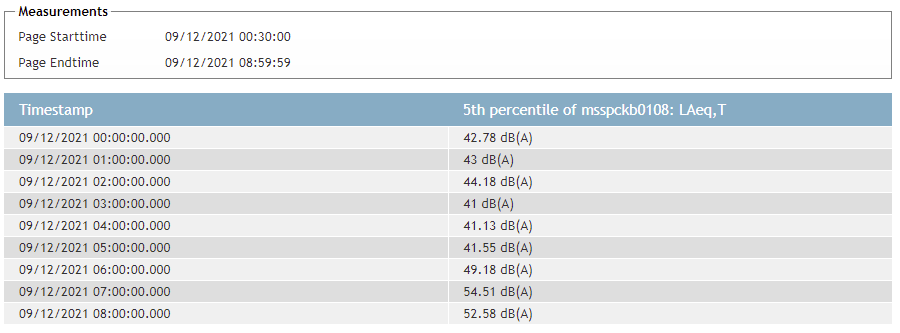
When a block is incomplete, the value is calculated over the results that are present. In the example below, the start time of the query is set to 00:30:00. The value of 42.78 dB(A) is calculated over 00:30:00 until 00:59:59.
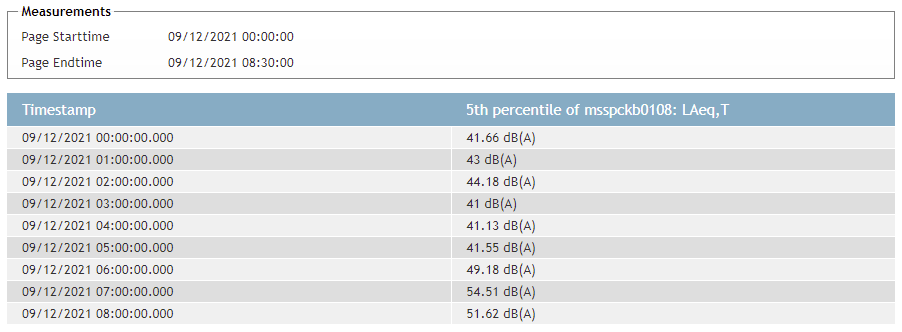
This also holds true for an incomplete block at the end of the query (08:00:00 until 08:30:00):
How do I view percentiles?
Showing percetiles is a proces with a few extra steps. First we start on the Graph page (Graphics)
Here you select for example the LAeq values and select a period to show a graph by pressing execute.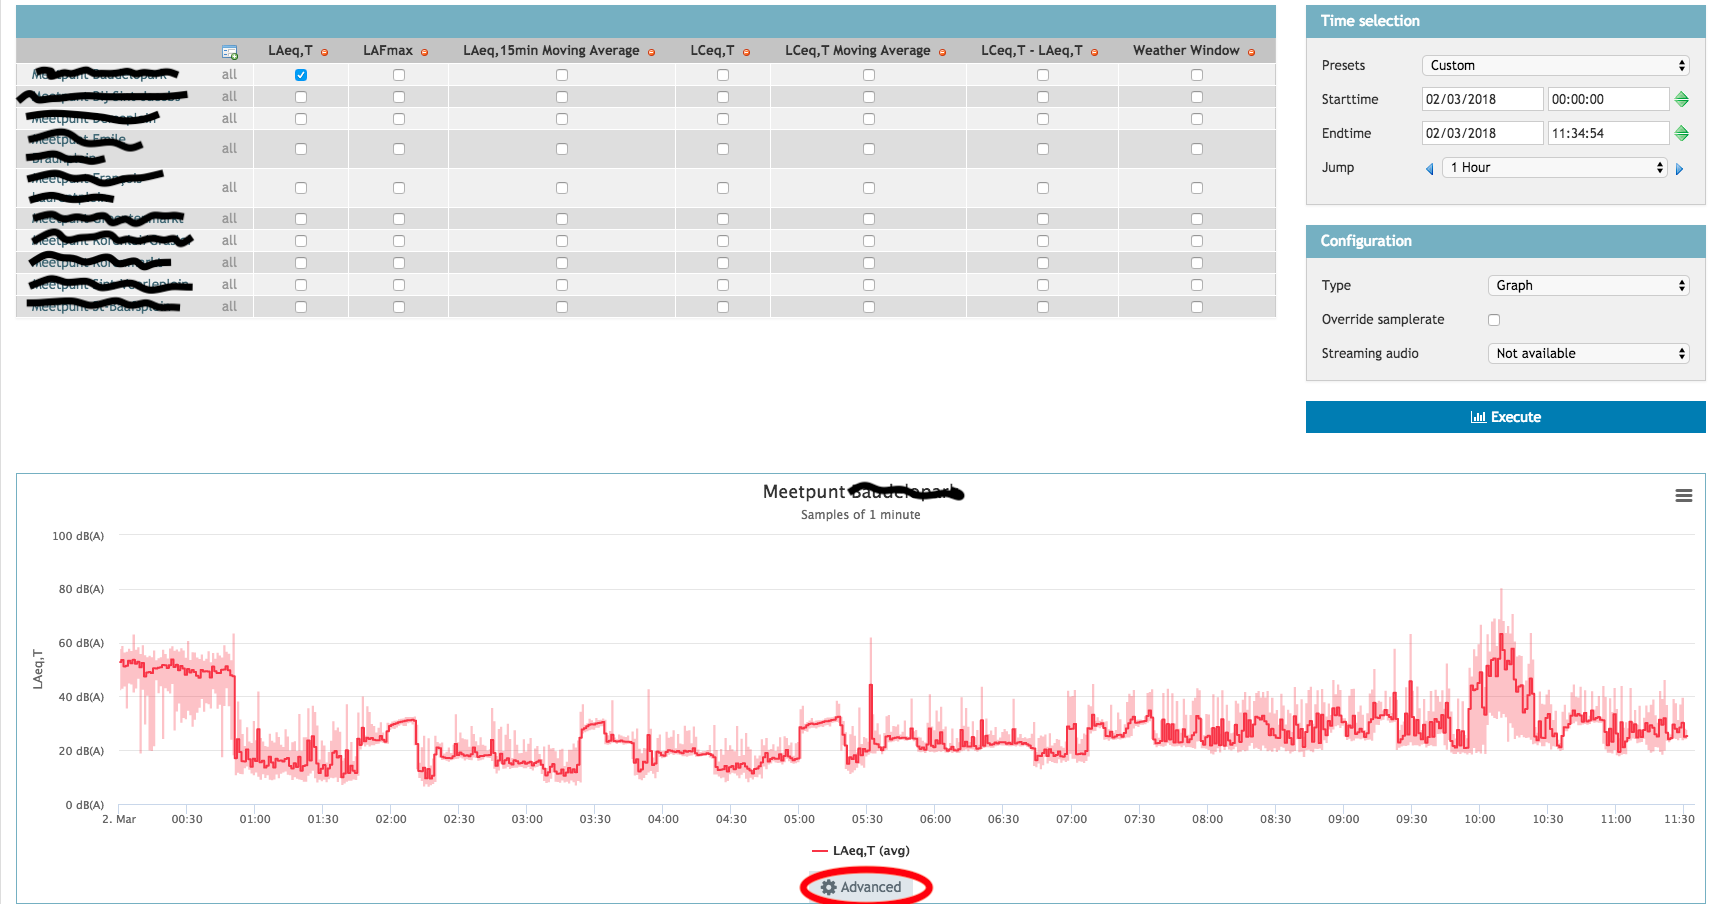
When the graph has been drawn you click advanced to go to the advanced query page. 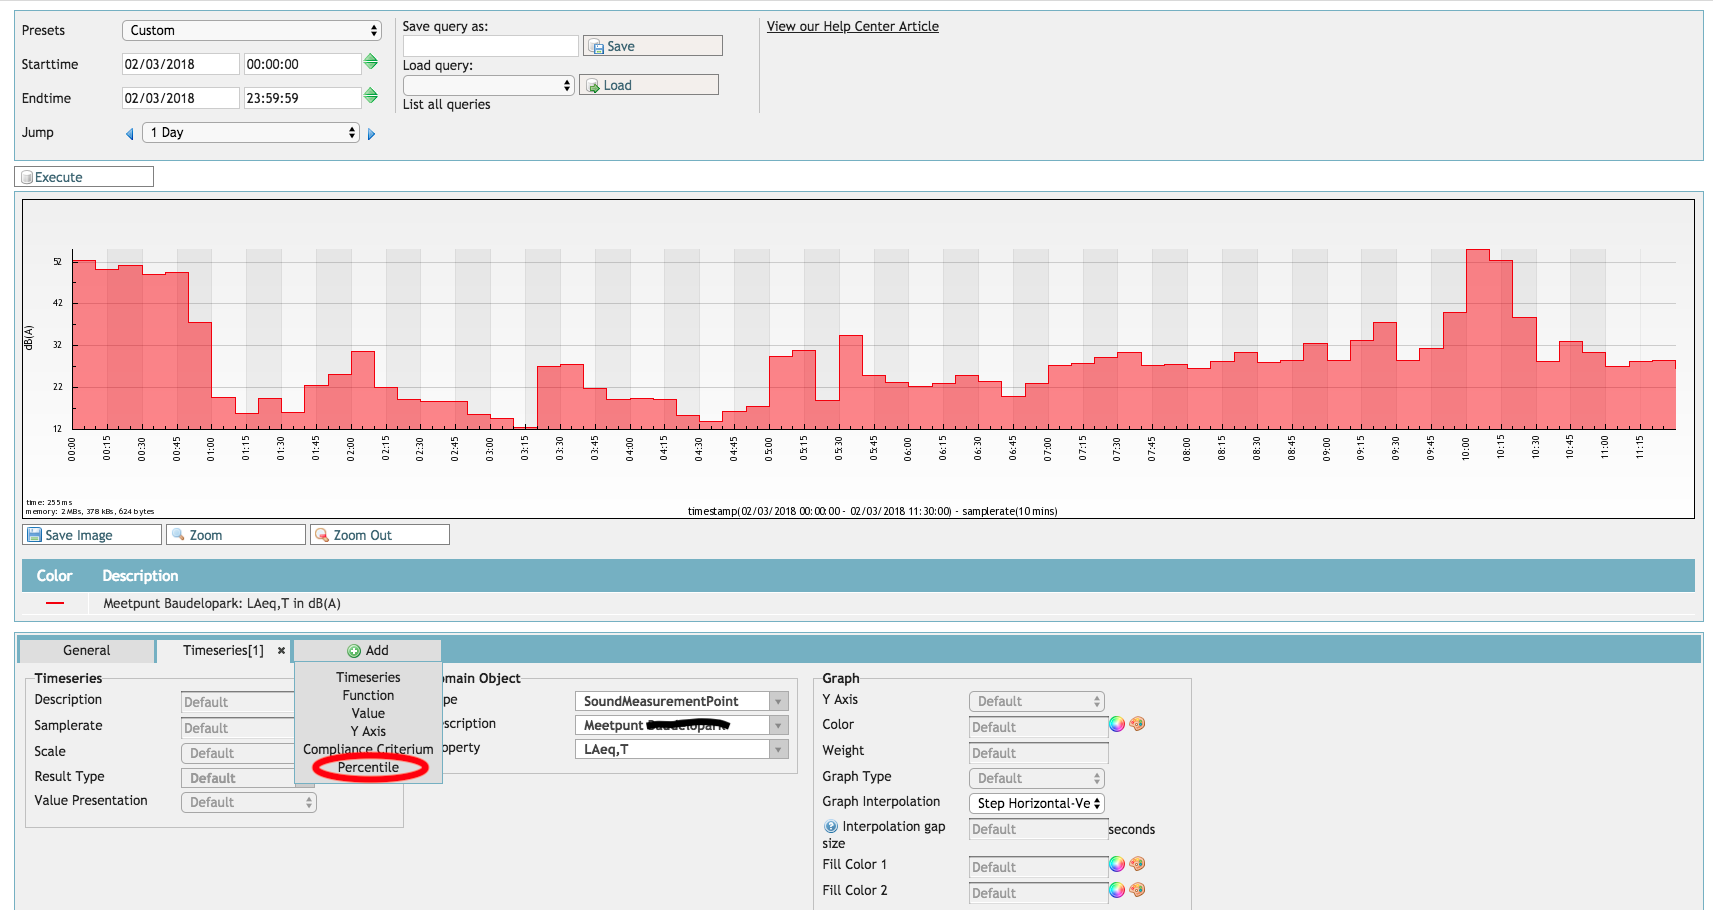
Press "Add" to create an extra tab and press on "Percentile". You can edit this tab to your own liking.
Firstly you pick a type (often this is a SoundMeasurementPoint), the measurementpoint you want to check and which property you want to see (for example: LAeq, LCeq or LASmax/min).
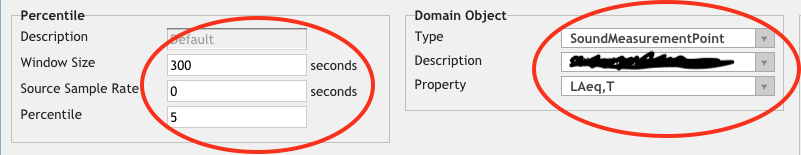
After this you must set a few parameters for the percentiles. The window size is the period on which the percentiles should be calculated. The source lample rate defines how many samples should be taken in this timeframe (this should most likely be set to 0). Finally you set which percentiles you want calculated. In this example the percentile is set to be the 95th percentile with a time period (window size) of 5 minutes and all the samples that are available.
When clicking execute a graph wil be drawn with the original LAeq values and the percentiles. In the example below the 95 percentile is shown in blue and the LAeq as a red line. 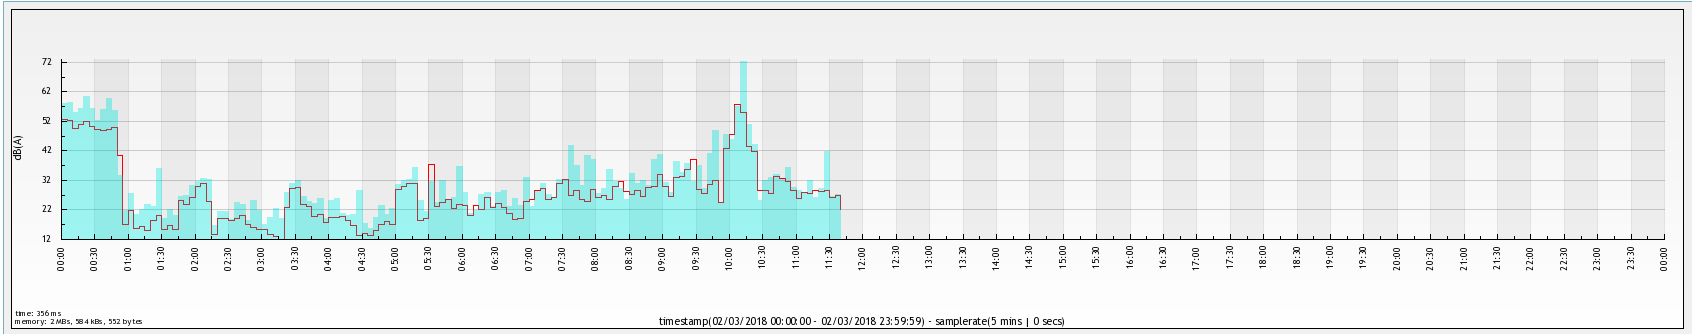
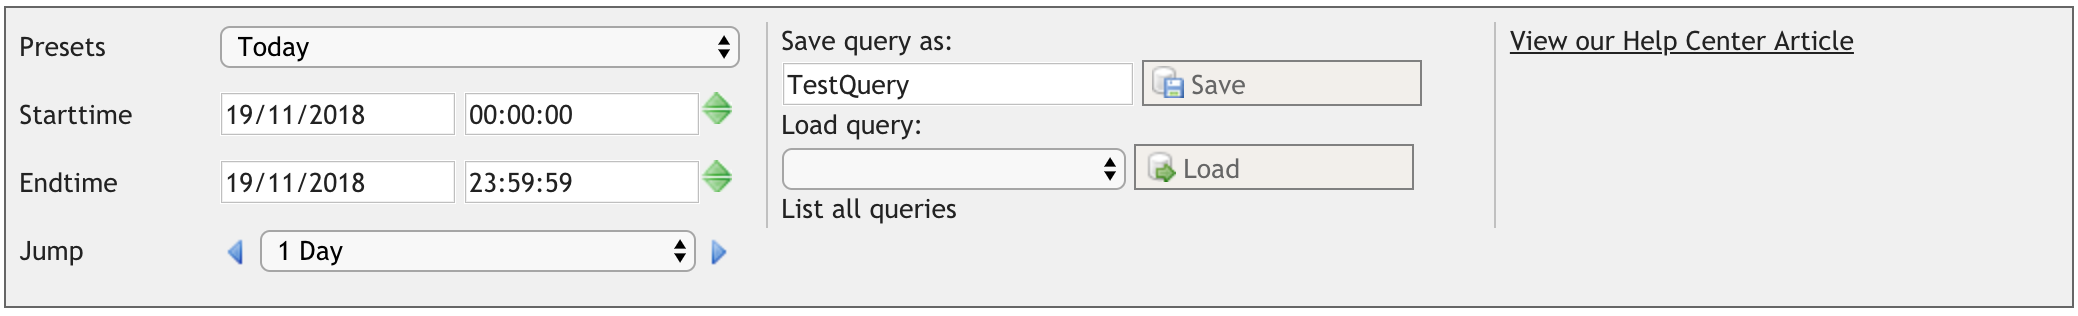
Saving a percentile as a template
The created query can be saved as a template so that you can simply edit the timeseries in the newly loaded query.
To create a template you fist have to create the query as setup above. After this you give the template a name under "Save Query As" and press save. The query can be loaded the same way by selecting it from the list and pressing "Load Query".
In our Article about the query page you can find additional information: Query-page
Exporting percentiles
To export percentiles using the Export Tool, create a new job by giving it a description and selecting any measurement point or group of measurement points. Select Export Percentiles (CSV) as the action:
Using the following example settings will create an export of the LAeq,60min property, for the 95th, 50th and 5th percentiles on 17-10-2022 between 00:00:00 and 23:59:59:
0 Comments