Looking for a downloadable PDF manual? The link can be found at the bottom of the page.
Sound Event is the name of a collection of pages that are specifically designed to monitor events and take action when certain situations occur. Because Sound Event can be configured with a number of different options, not all functionality described in this article might be available to you. If there is functionality you want to see added to your own Sound Event, please use Zendesk to contact us with your request.
List
The first page of Sound Event is the list view. On this page you will see all current, future and a number of past events in your selected group. Use the group dropdown selector at the top of the page to change the group. If you only have access to one group, this selector is not available.
The large red buttons provide some basic functions. Please note that not all buttons might be available in your version of Sound Event. The nieuw evenement button allows you to manually create new events (more about events in the section Managing events). The handleiding button will provide you with a small and quick PDF manual about the creation of events. Wijzig template can be used to change the format and settings of events that are automatically created if this is turned on. Terug naar de portal will take you out of Sound Event and back to the Munisense portal.
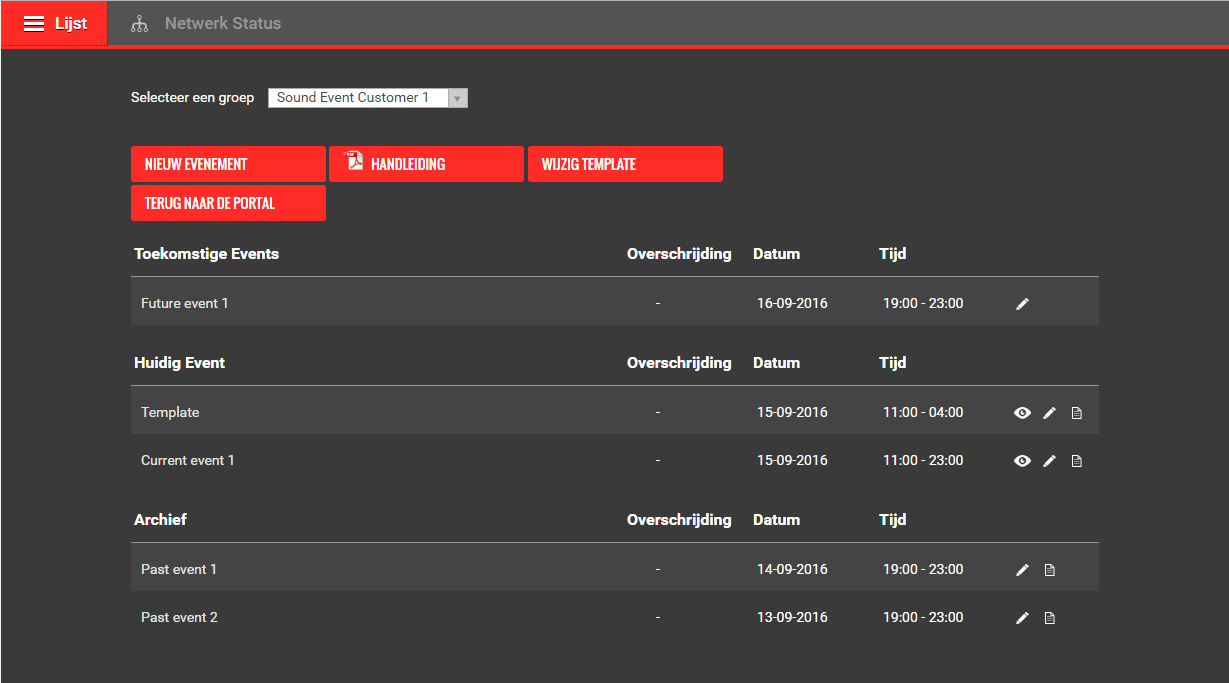
You can click on the name of an event or the icons on the right to view different aspects of the events. The amount of options available depend on the timeframe of the event, if it is current, in the future or in the past.
Clicking the eye icon or on the event name will take you to the Dashboard view (more about this page will be explained in its own section). This page can be used to monitor different types of sound levels in realtime. The Dashboard view is only available for current events.
Clicking the pencil icon allows you to edit the event's properties such as the name, threshold values to be used during realtime monitoring and alarms.
The document icon will generate a small printable report in your web browser that contains most relevant data gathered during the event. Reports can only be generated for current and past events.
Managing events
A sound event offers insight in the sound levels produced during an event. It groups the sound data based on the chosen event time to offer easy insight into the sound produced during the event.
If the red button nieuw evenement is available, you can manually create new events using the list view described in the above section. Clicking on an event will allow you to view the sound levels using regie and grafiek.
A sound event has a duration of a maximum of one day. If you are monitoring an event that takes place over multiple days you must create an event for each day.
General settings
For an event you can configure the following:
Naam: the name under which the event can be found
Locatie: the location and sound meter coupled to this event
Stagemanager: the person responsible for this event
Datum: the day on which the event takes place
Tijd: the duration of the event
Logingegevens Geluidregie
Gebruiker aanmaken: Create a new user that only has access to view realtime information under regie and historic data under grafiek
Grenswaarden
Middeling periode: The period over which the sound is averaged and displayed in the regie and grafiek view
Langetermijn: Over which period the long term values and graph must be calculated
Both the short and long term averages have optional threshold values in dB(A) and dB(C).
Grenswaarde Spectraal: The optional threshold for spectral measurements. This can be used in combination with sound correlation functionality that is available only with the correct meters and configuration.
Alarmen
Up to 4 users may be selected to receive alerts in the form of an email or SMS if the current LAeq and/or LCeq averages exceed the configured thresholds. For this to work, make sure that under your user settings, you have set an email address and phone number and ensure that notifications are set to enable. Also make sure the email address is valid and that the messages do not end up in the spam folder. The phone number must use a country code prefix, for example +31 for the Netherlands.
Dashboard
The regie Dashboard is the page on which the sound levels of an event can be monitored in realtime. In the example below, the page is divided into five separate blocks. Depending on the configuration, the number of blocks may change and the properties on display can be different. In this example, LAeq and LCeq, both the 15-minute average and the long term (60-minute) average are displayed.
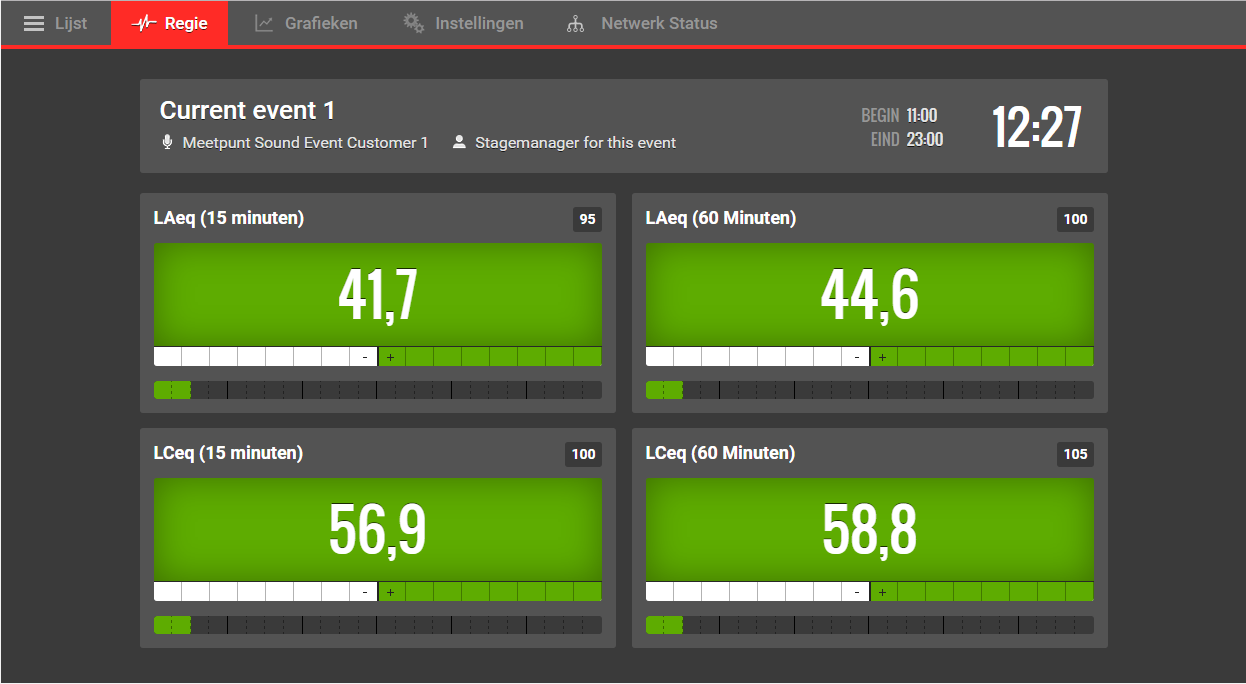
The upper block shows the general information about the event. The name of the event, the measurement point and the optional stage manager. Next to that, the start- and end time of the event can be displayed and the number of hours and minutes left until the end of the event.
The four other blocks each display a property of the measured sound, in this example the LAeq and LCeq over a configured time period (15 or 60 minutes moving average).
The large number shows the moving average over the last time period. The small number in the right upper corner shows the configured limit for the property. Depending on the current measured sound level, the green background behind the large number will change color based on how close the value is to the limit. Yellow means it is approaching the limit, orange means the value is currently in the critical zone and red means it is in excess of the limit.
The white bar beneath the indicator, colored green toward the right side, displays the headroom. This indicates in blocks of 1 dB how much louder one can play in the next minute without exceeding the limit. The other way around, if the value has exceeded the limit, it will indicate how much quieter one must play to get under the limit within the next minute.
The bottom bar, that will be empty for the most part in the beginning of the event displays historic information. Each block uses colors to display the average of the past periods and on mouse-over the value in dB(A) or dB(C).
Graphs
Grafieken is a page on which historic data can be viewed over time. If an event is still going on, the page will get the new data upon each visit. This is not a realtime page like the regie dashboard. Also, when the event has ended, the entire course will remain visible.

Just like on the regie page, the upper block shows the general information about the event. The name of the event, the measurement point and the optional stage manager. The start- and end time of the event and the number of hours and minutes left until the end of the event can also be displayed.
The two graphs display the moving average over time of both the LAeq and LCeq. The same graph also shows the limit and optionally the budget.
Furthermore, at the bottom of the page the current LAeq and LCeq long term averages are shown. When the event has ended the current long term averages will continue to be displayed. As seen in the example above, these will no longer match the last values in the graph from that moment on.
0 Comments