This page describes on how to use the new interface for water validation. The new interface is not yet enabled for every customer, if you are not sure what version you have please contact support.
List page
The list page has four tables to group objects with a specific state. The count of these objects is also displayed on the top of the page. With the group selector in the top right corner (when multiple groups are present) you can switch between groups.
The first table has "Objects with rejected results", this are objects that require attention. The automatic validation has detected rejected results. You can see the date of the first and last detected results with a counter indicating the amount of results. In the right column the automatic validation progress is displayed.

When the automatic validation did not detect any problems the objects are listed in "Objects with automatic accepted results". These results probably don't require immediate attention but it is recommenced to check these objects from time to time. Again you can see the first and last object that is not yet manually validated together with the count.

When you verify all results (either by marking it as 'ok' or by 'accepting' it (more on this later)) the object will be moved to the "Objects that are manually validated (OK)". In short: objects that are displayed here do not require any attention, there are no results pending to be validated. For clarification the first/last result are also displayed here so you know what period is validated (handy to detect whether you revalidated some data after a import of measurement data). Please note that it is possible for an object to be "ok" and yet still is not 100% complete. This indicator only looks at validated results, not results that are still 'todo'.

The last table lists "Objects with validation disabled", if you find your objects here please make sure you have assigned both Validation Criteria as Validation Display Rules to it. If you can't find the problem please ask our support so we can find out what the problem is.
Validation View
When you select an object you will see the validation view page. It might be strange to see a big (empty) graph and a small graph but see the bottom graph as your "time selector". This is quite handy as you have a longterm overview at any moment during your validation process!
Both graphs use the same colors for the results so simply select the area you are interested in and the big graph will zoom to that area.
As a validator you will always see all data. Results are marked red when the validation has been triggered, when you mouse-over that block you will get an popup with the reason of the problem. By using the 3 small buttons om the top right of the page you can switch between what you can see and what your customers can see!
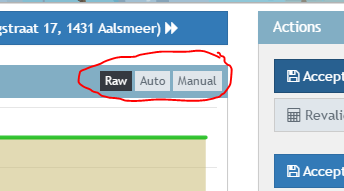
Raw will simply display all available data, auto will display data that has passed the automatic validation while manual only displays data that has been accepted by you (the validator).
You can compare these buttons with the following display rules:
- Raw: all
- Auto: Automatic OR manual validated results
- Manual: Automatic AND manual validated results
These display rules are displayed in the bottom right corner for your convenience.
Manipulating data
When you select a piece of data in the main graph you will see some additional buttons (more on the table will follow). These buttons do actions on the selection you've just made.
- Accept: This button accepts the result as-is, use this if you are satisfied with the outcome of the automatic validation
- Mark OK: If the automatic validation has marked some data as rejected but you think that is incorrect you can use this button to correct it. The data will also be automatically 'accepted'.
- Mark Rejected: The opposite of the 'ok' action, will mark data as rejected.
- Annotate: Will link to the annotation page so you can create an annotation for the selected range.
- Zoom: Use this to fine-tune your zoom-level
- Reset validation: Will remove any manual override (result will be like it was after the automatic validation)
- Revalidate: Marks the selected time range for revalidation.
Table
To give you more control on small datasets you can use the table. Again: simply select some data in the main graph and the table appears. You can see the timestamp, value, state, triggered validation rule (if any) and the "accept", "ok" and "reject" buttons (see above).
Actions / Metadata
On top of your screen you can browse through the domainobjects, only objects with unvalidated data will be displayed here.
On the right of the screen there are 2 actions. The first action is related to the timespan selected in the bottom graph (handy if you want to revalidate a large timespan). The second action is for the entire range visible in the bottom graph.
The metadata, validation criteria and display rules are there as a reminder. These also include buttons (the pencil icon) to link directory to the correct pages.
0 Comments