Some of our soundmeters have the ability to record spectral data. The portal has special tools available to display the individual terts values in graphs and tables. Before you can start analyzing this data you have to make sure your meter is capable. To check this, go to the Sound Measurement Point of the soundmeter you want to use as your source of spectral data.

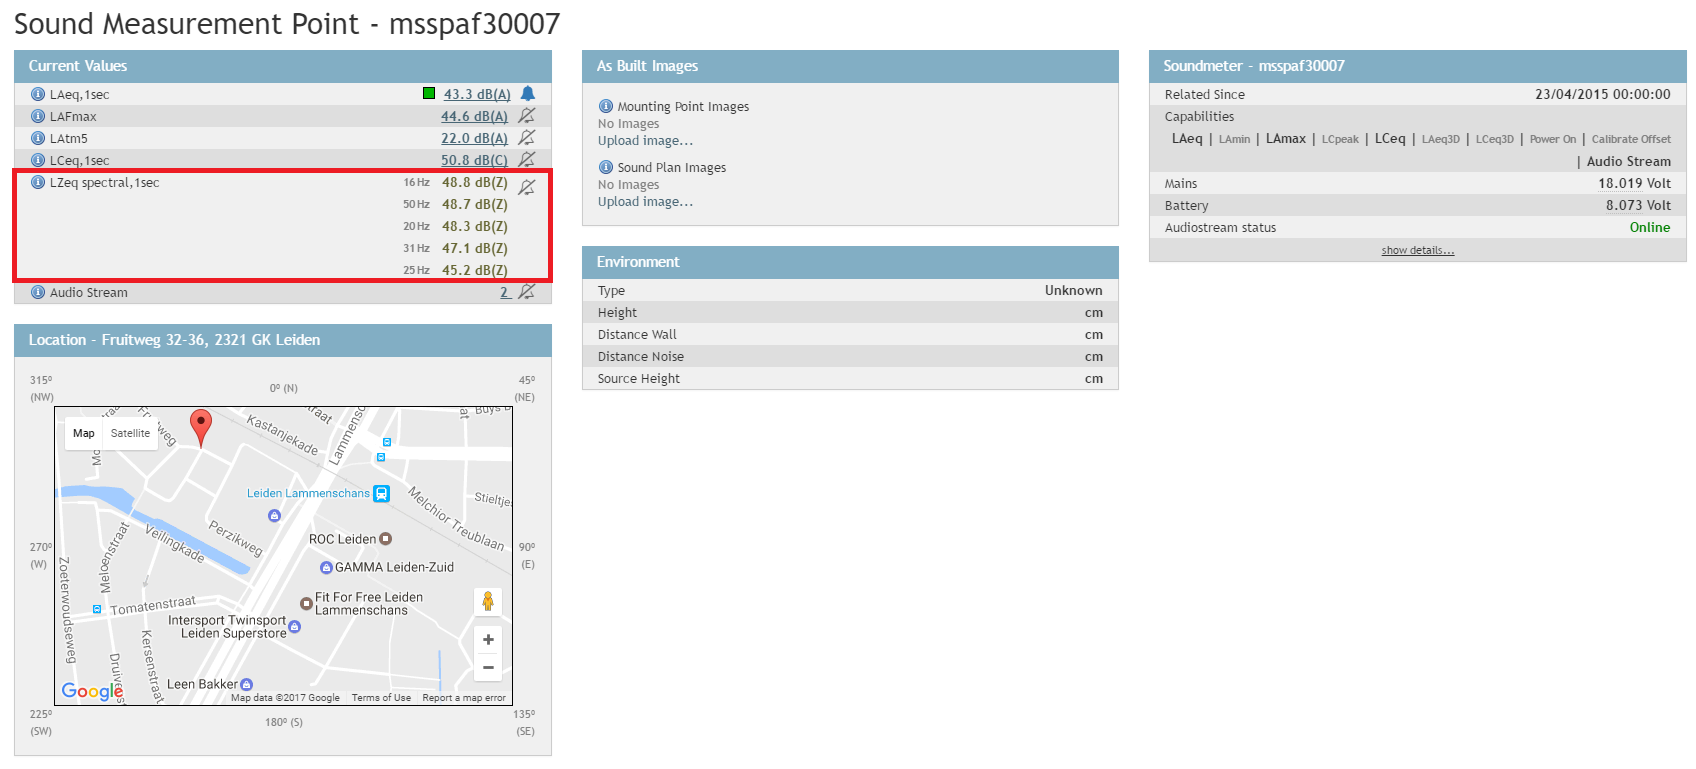
If you see the above set of values under Current Values the measurement point has a meter coupled that can record spectral data with the values displayed as dB(Z) (unweighted).
Now you are ready to start analyzing. Find the Simple Query viewset in your portal. It might be listed in the menu under a different name. Very often it is called Graphs and it looks like the image below.
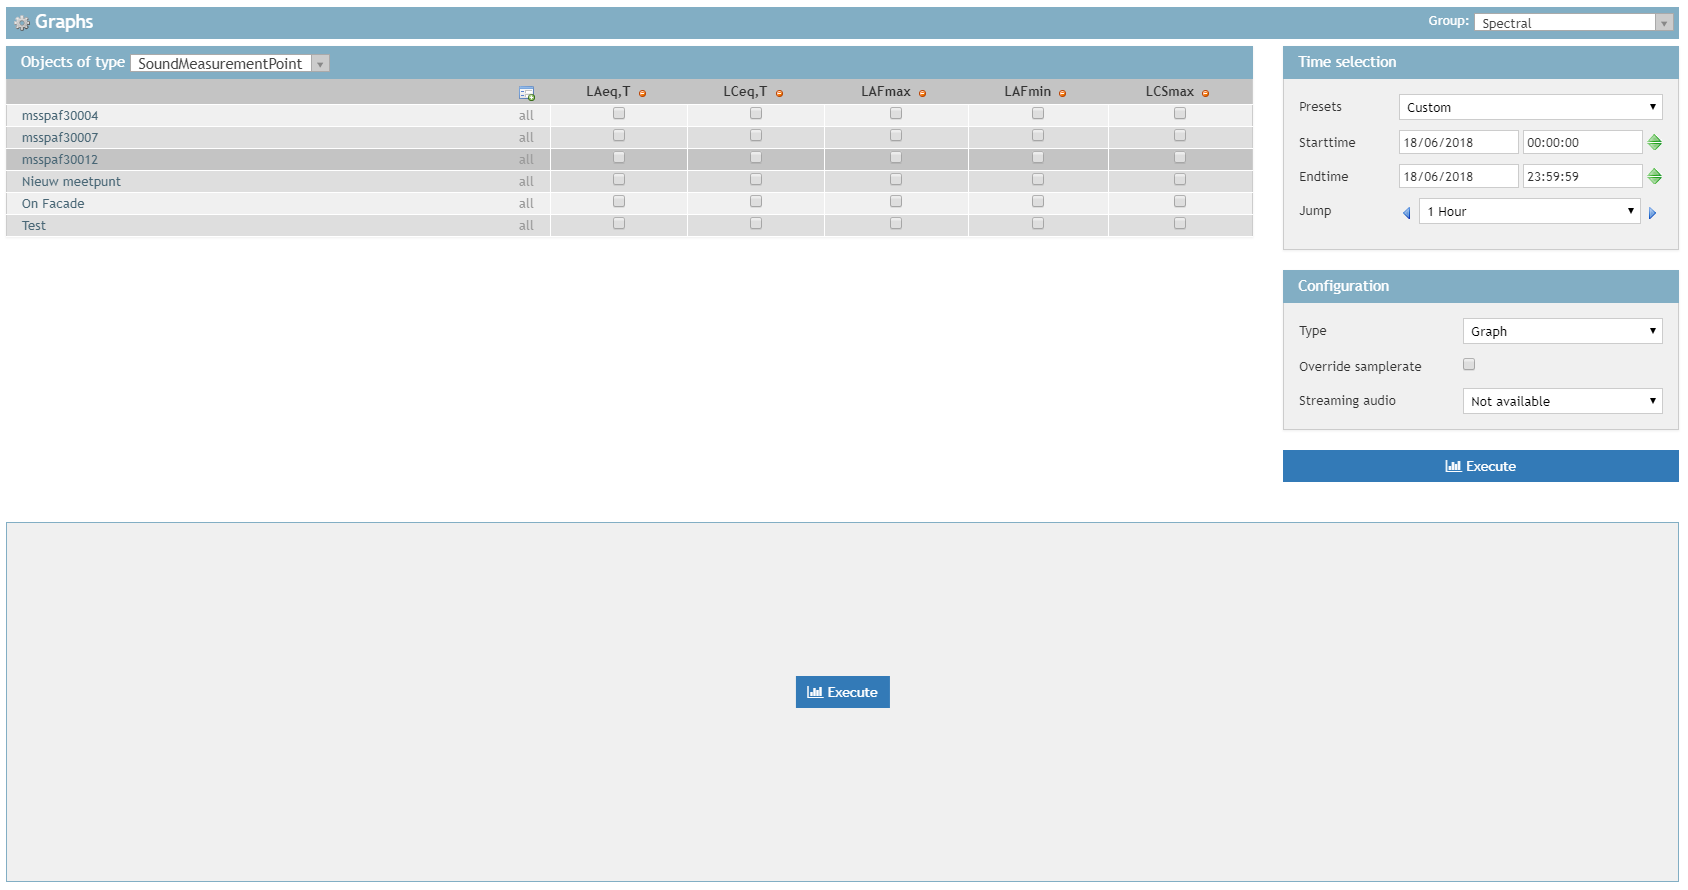
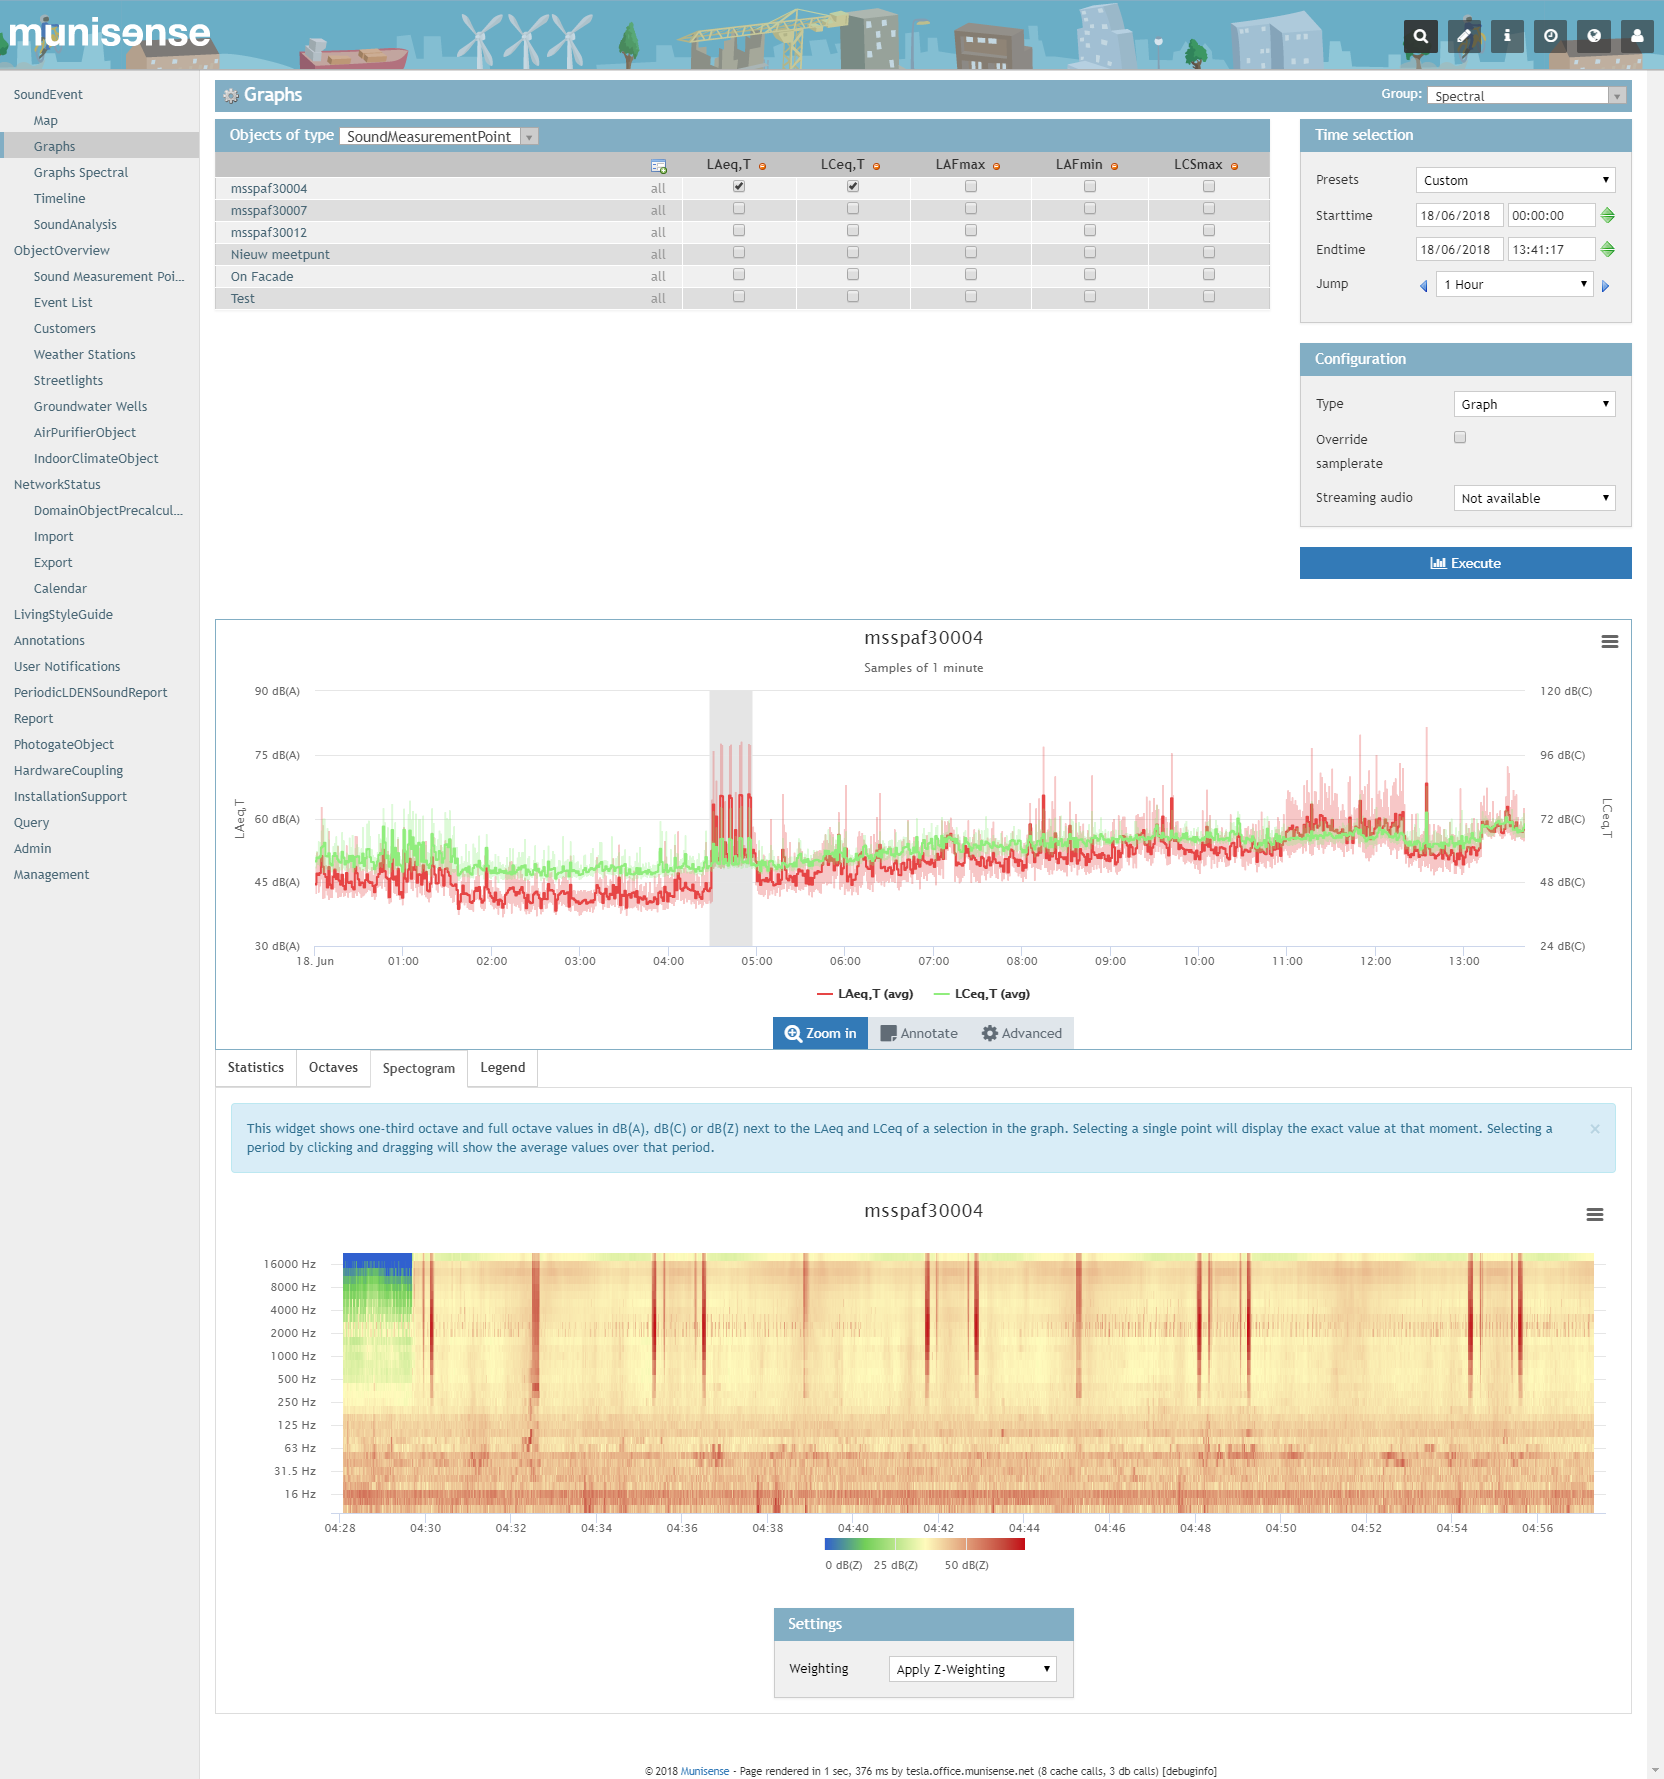
To view spectral data, select one or more properties using the checkboxes and click on one of the Execute buttons to load the graph. After it is loaded you can click and drag on the graph image to show a maximum of 30 minutes of spectral data from your selection. An example selection will look like the image below.
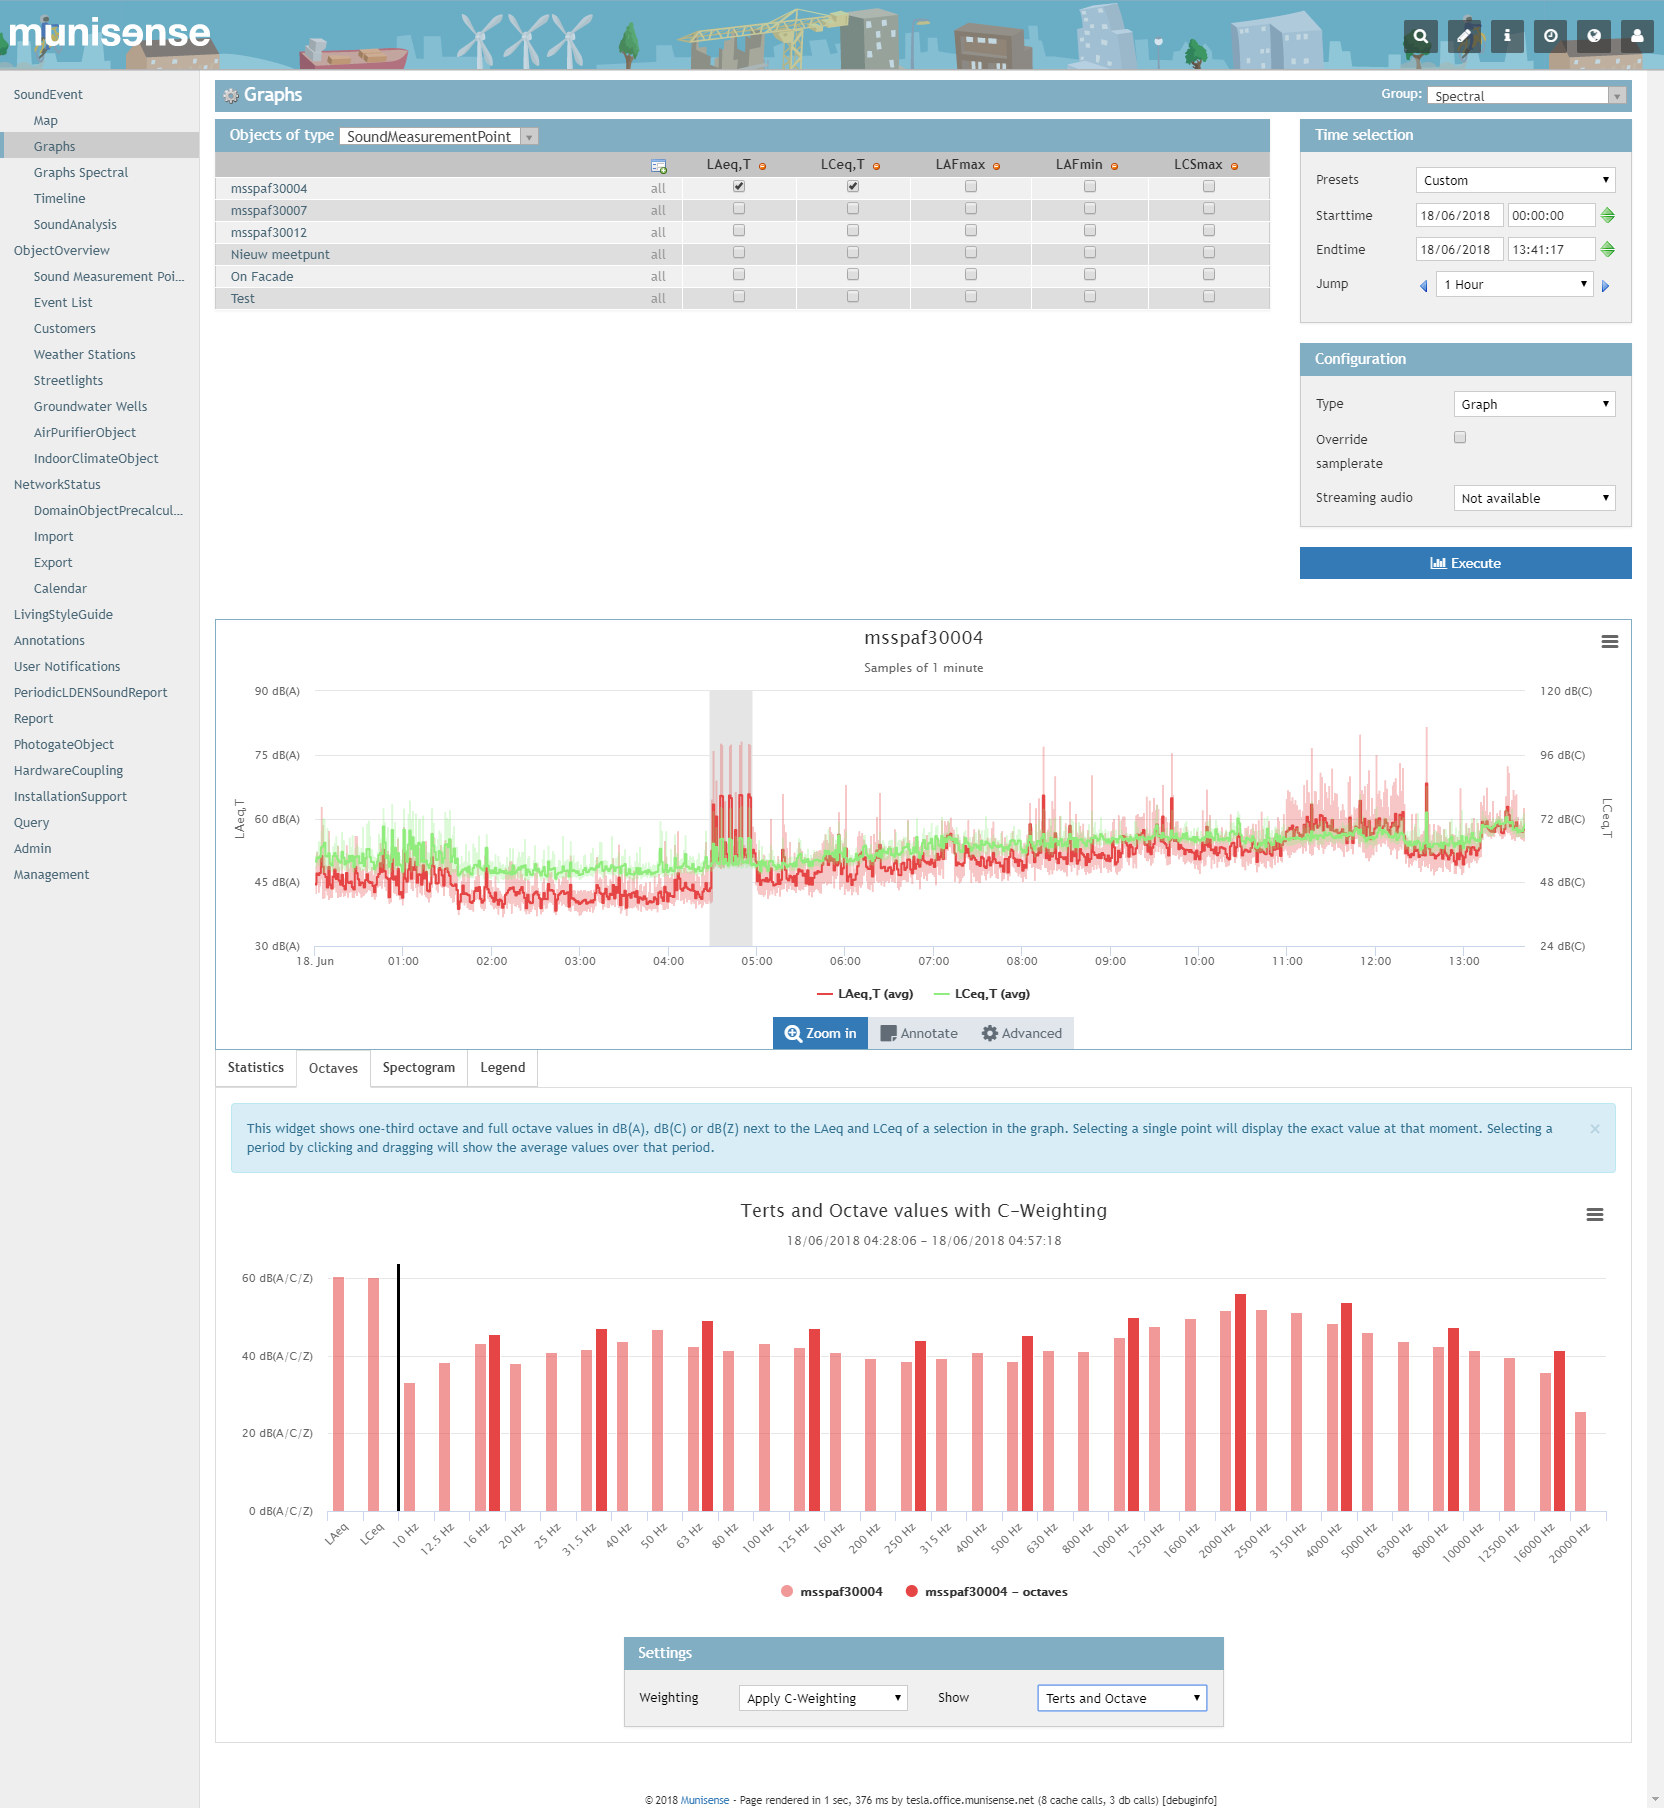
It is also possible to view the individual terts and octave bands.
0 Comments